Unemployment and Poverty: A Relationship Analysis
By Rachel Williams | Spring 2026 – Volume 16
Introduction
The purpose of this study is to highlight the relationship
between the poverty rate and the unemployment rate in
the United States (U.S.) with hopes of shedding light on
how changes in national unemployment rates are
associated with changes in the poverty rate. The poverty
rate represents the share of individuals whose incomes
fall below the U.S. Census official poverty measure
threshold, while the unemployment rate measures the
portion of the labor force unable to find work. Intuition
suggests these indicators are closely linked as job loss
directly reduces household income, increasing the
likelihood of falling into poverty for individuals without
financial buffers. The expected causal direction runs from
unemployment to poverty. In other words, rising
unemployment can lead to increases in poverty, whereas
increases in the poverty level are less likely to directly
increase unemployment. Furthermore, it is predicted that
the relationship is moderate as factors such as public
assistance programs may decrease or delay the effect of
unemployment on poverty. Thus, a positive relationship is
anticipated, potentially with unemployment movements
preceding changes in poverty with a slight lag. This study
focuses on descriptive associations and does not attempt
to establish a causal relationship between unemployment
and poverty.
The benchmark values of 13.40% (poverty) and 5.62%
(unemployment) over 1995–2023 are drawn from
commonly reported national averages based on the U.S.
Census Bureau data (Federal Reserve Bank of St. Louis,
n.d.). Given that the benchmarks are derived from the
same underlying data sources as the sample, the onesample
t-tests should be interpreted as descriptive
comparisons rather than independent statistical tests.
Accordingly, the results indicate that both tests fail to
reject the null hypothesis at the 5% significance level,
suggesting that there is no statistical evidence that the
mean poverty rate or unemployment
rate exceeds the benchmark values. These findings should
be interpreted as contextual information highlighting the
limitations of applying inferential statistical tests to
aggregate time-series data in this setting.
Data
The data analyzed in this study was extracted from
Federal Reserve Economic Data (FRED). The final
sample contains 29 annual observations of poverty rate
and unemployment rate for years 1995-2023 on January
1st each year. As stated above, the poverty rate is the ratio
of the number of people whose income falls below the
defined poverty threshold to the total population.
Poverty is measured using the official poverty measure
and supplemental poverty measure as defined by the U.S.
Census Bureau (Federal Reserve Bank of St. Louis, n.d.)
. The unemployment rate represents the number of
unemployed as a percentage of the labor force. Labor
force data are restricted to people 16 years of age and
older, who currently reside in 1 of the 50 states or the
District of Columbia, who do not reside in institutions,
and who are not on active duty in the Armed Forces
(Federal Reserve Bank of St. Louis, n.d.). Observations
from 1983 to 1994 were not included because the poverty
rate was not consistently observed.
Please note the relationship between median household
income and the poverty rate reported in the Federal
Reserve Economic Data is not analyzed in this study
because, although the median is less influenced by
extreme income values, it may not capture relevant
changes affecting those at the bottom of the income
distribution. Median income can remain stable even when
poverty rises, especially during periods where income
gains are concentrated around the middle.
Therefore, analyzing median income does not meet the
goals of this study, as it does not adequately represent
populations in poverty, who are more vulnerable to price
shocks and less buffered by savings or wage growth. In
comparison, estimating the relationship between poverty
rate and unemployment rate provides valuable insight
into how joblessness can diminish
household income and potentially increase economic
hardship.
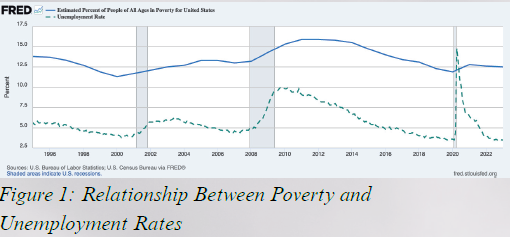

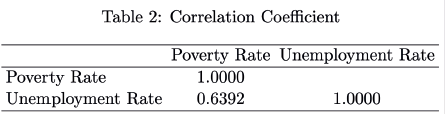
Based on Figure 1, there is a moderate positive
correlation between the poverty rate and unemployment
rate (r = 0.6392). This relationship is further supported
by Table 1, which shows that the highest poverty rate
occurred in 2010 (15.9%), while the highest
unemployment rate occurred in 2011 (9.6%), suggesting a
slight lag between changes in the two variables. This is
intuitive as individuals may employ personal savings or
public assistance programs to temporarily delay their
descent into poverty after unemployment.
During recessions, the relationship between the
unemployment rate and the poverty rate becomes
stronger, particularly during periods with less extensive
government support. For instance, from 2008–2011,
unemployment spiked abruptly and poverty rose
significantly alongside it, suggesting that both variables
increased substantially during the Great Recession and
reflects the magnitude of the economic downturn rather
than a structural strengthening of their relationship
(Rich, 2013). Federal welfare spending in 2010 was $1.074
trillion (Chantrill, n.d.).
In contrast, during the COVID-19 recession in 2020, the
unemployment rate increased by about 4% while the
poverty rate rose by only around 1%. In 2020, federal
welfare spending was about $2.4 trillion (Nowrasteh and
Howard, 2023). Notably, 2020 is consistent with the idea
that unemployment insurance and expanded government
assistance may cushion unemployed workers by stabilizing
income and reducing the risk that job loss leads to
poverty.
This pattern is consistent with the possibility that greater
government intervention in 2020 was associated with a
weaker unemployment–poverty relationship than the
Great Recession. Additional research should be
conducted to determine the extent of the causal effect of
government spending impact on the relationship between
the unemployment and poverty rate. Overall, the
moderately positive correlation coefficient of 0.6392
between the poverty rate and unemployment rate
reflected in Table 2 is intuitive as the relationship
relatively neutralizes over time.
Analysis
To determine whether the sample means of the poverty
rate and unemployment rate accurately represent their
population means, one-sample t-tests for each sample
were conducted. This statistical method is appropriate as
the goal is to compare the mean of a sample with less
than 30 observations to a hypothesized population mean
with an unknown population standard deviation.
The following hypothesis test was used to test the
poverty rate at a 5% significance level: H₀: μ = 13.40
H₁: μ > 13.40
The following hypothesis test was used to test the
unemployment rate at a 5% significance level:
H₀: μ = 5.62
H₁: μ > 5.62

Based on Table 3, both tests fail to reject the null
hypothesis by a substantial margin because for poverty
rate (Table 3) a p-value of 0.5056 is larger than 0.05, and
for unemployment rate (Table 4) a p-value of 0.4949 is
larger than 0.05. Accordingly, the tests provide no
statistical evidence that the population poverty rate
exceeds 13.40% or that the population unemployment rate
exceeds 5.62%, given the chosen one-sided hypotheses.
These results are intuitive as both the poverty rate and
unemployment rate tend to change gradually rather than
fluctuate quickly over time. The confidence intervals
indicate that the average levels of these variables are
relatively stable across the sample period. For the poverty
rate, the results state one can be 95% confident that the
interval from 12.89847% to 13.89464% contains the true
population mean. For the unemployment rate, the results
state one can be 95% confident that the interval from
4.970051% to 6.278225% contains the true population
mean unemployment rate. The confidence intervals
indicate that the true mean poverty and unemployment
rates are likely close to the sample averages.
However, these estimates do not provide
insight into the relationship between
unemployment and poverty, which is better
captured by their co-movement over time and the
observed correlation between the two variables. As
such, the primary focus of the analysis is on the
association between unemployment and poverty,
rather than the average level of each variable in
isolation. These tests do not provide independent
evidence and are not informative about the
relationship between unemployment and poverty
because the benchmark values are derived from the
same underlying data sources as the sample. This
unemployment and poverty relationship is instead
evaluated using their correlation and co-movement
over time.
Conclusion
The data displays a moderately positive correlation
between unemployment and poverty, with a slight time
lag. While the study recognizes government intervention
could weaken this relationship, further analysis is needed
to isolate its true impact. Although one-sample t-tests fail
to reject the null hypotheses, these tests are not
informative in this context because the benchmark values
are derived from the same underlying data sources as the
sample. As such, the primary evidence on the relationship
between unemployment and poverty comes from their
observed correlation and co-movement over time. More
analysis is needed to evaluate sampling bias and confirm
whether these findings hold across different subgroups or
time periods.
Chantrill, C. (n.d.). Analysis of recent US welfare spending.
USGovernmentSpending.com. Retrieved May 2, 2025, from
https://www.usgovernmentspending.com/welfare_spending_analy
sis
Federal Reserve Bank of St. Louis. (n.d.). Estimate of people of
all ages in poverty in the united states. FRED, Federal Reserve
Bank of St. Louis. Retrieved September 1, 2025, from
https://fred.stlouisfed.org/series/PEAAUS00000A647NCEN
Federal Reserve Bank of St. Louis. (n.d.). Poverty rate
[POVRATE]. FRED, Federal Reserve Economic Data. Retrieved
April 28, 2025, from
https://fred.stlouisfed.org/series/POVRATE
Federal Reserve Bank of St. Louis. (n.d.). Unemployment rate
[UNRATE]. FRED, Federal Reserve Bank of St. Louis.
Retrieved April 28, 2025, from
https://fred.stlouisfed.org/series/UNRATE
Nowrasteh, A., & Howard, M. (2022, March 30). Immigrant
and native consumption of means-tested welfare and
entitlement benefits in 2019. Cato Institute Briefing Paper No.
- Retrieved May 2, 2025, from
https://www.cato.org/briefing-paper/immigrant-nativeconsumption-
means-tested-welfare-entitle ment-benefits-2020
Rich, R. (2013, November 22). The great recession. Federal
Reserve History. Retrieved
September 1, 2025, from
https://www.federalreservehistory.org/essays/great-recessionof-
200709#:~:text=Lasting%