Shloka Mohanty | Spring 2025
Engel curves illustrate how the consumption of goods changes as income increases. A classic example from ECON 301 is instant ramen noodles: as income rises, the consumption of this staple typically declines, classifying it as an inferior good. However, this relationship can vary by country.
In India, instant ramen is often perceived as a premium product and is typically found in high-end grocery stores. While many people might think of Maggi when discussing this topic, it’s important to note that Maggi is not an instant ramen brand. Instead, it is an instant noodle brand many Indians grew up with. Maggi is inexpensive, widely available, and locally manufactured. It has become an integral part of Indian food culture, much like tea.
On the other hand, instant ramen usually refers to imported East Asian noodles, such as Shin Ramyun, Samyang, and Nongshim. These brands offer more complex flavors, exotic branding, and higher prices. Often marketed as premium, spicy, and international, they are considered luxury goods.
This raises an interesting question: can Engel curves be used to measure a country’s income level? Additionally, do they provide insights into nutrition?
Understanding Engel Curves
Engel curves illustrate a consumer’s expansion path at fixed prices, showing how the quantity of goods consumed changes with income. Normal goods can be categorized into two types: normal necessity goods and luxury goods. The income elasticity of demand for normal necessity goods ranges from 0 to 1, indicating that consumption increases as income rises. In contrast, luxury goods have an income elasticity of demand greater than 1. On the other hand, inferior goods exhibit negative income elasticity, meaning that demand decreases as income increases.
Income significantly influences food choices and impacts nutrition. According to Bennett’s Law (1941), as incomes rise, diets tend to shift from reliance on starchy staples to a more diverse array of food groups (Clements & Si, 2018). In the United States, wealthier individuals often reside in neighborhoods with greater access to grocery stores that stock fresh produce, whole grains, and lean proteins, such as those found at Whole Foods. However, research by Kumar, T. Krishna, and others suggests that in developing nations like India, as incomes increase, diets often shift toward processed foods. This trend is evident in reports from Euromonitor and Nielsen, which indicate that fast food chains like Domino’s, McDonald’s, and KFC, along with local snack brands, have experienced steady growth in sales in India. This increase has been largely driven by rising disposable incomes among the urban middle class. Consequently, being wealthier does not necessarily lead to healthier eating habits; in fact, it can result in the consumption of less healthy foods.
Income, Food Demand, and Nutrition
A study by Colen and others looked at how people’s food spending changes as they earn more money. They found that basic foods like rice or wheat (called staples) don’t see much of a spending increase as income rises—these foods are less responsive to income changes. But for luxury foods, spending increases more sharply with higher income.
In Africa, for example, data shows that as people earn more, they do spend more on food—but the rate of increase slows over time. On average, people increase their food spending by about 61 cents for every extra dollar earned, showing that food is a necessity, not a luxury.
In India, which reflects broader trends in many developing countries, similar patterns are seen. Spending on staple foods tends to level off as incomes rise (flattening Engel curves), while spending on luxury foods, which in this case would be more processed foods, increases (producing steeper Engel curves). This reflects a nutrition transition, where wealthier households shift away from traditional diets and toward foods higher in fat, sugar, and additives.
Overall, income affects not just how much people spend on food but also what kinds of food they choose, leading to shifts in both diet quantity and quality, though the exact patterns can differ between countries.
Engel Curves as a Tool for Measuring Poverty
Engel curves provide an alternative perspective on poverty measurement that focuses on consumption rather than income. Kumar, Holla, and Guha introduce a consumption-based method known as the Food Deprivation Index. This index measures food spending shortfalls in relation to the saturation points of Engel curves, which serve as benchmarks for adequate food consumption. When households spend below these saturation points, it indicates food deprivation, regardless of their income level.
An analysis of data from India’s National Sample Survey Organization (NSSO) reveals that many households spend less on food than the amounts suggested by the Engel curves as being adequate, thus highlighting the issue of food deprivation. Traditional income-based poverty measures often fail to capture this reality, as many households classified as “above the poverty line” still struggle with food insecurity. Additionally, the gap in food deprivation between rural and urban areas has widened since economic reforms, with urban communities benefiting more significantly from economic growth compared to their rural counterparts.
This approach goes beyond fixed poverty lines by utilizing Engel curves, offering a more nuanced understanding of deprivation. It recognizes that poverty is not solely about income, but also about access to essential goods.
Engel Curves and Cross-Country Comparisons
Engel curves reveal clear global contrasts in food expenditure patterns. In developing nations, where per capita income is typically below $5,000, households spend a large portion of their budget on food—often over 40%—making food a dominant daily expense. In contrast, in high-income countries (with per capita incomes above $10,000), while people spend more money on food in absolute terms, it accounts for a much smaller share of their overall budget, often under 15% (Roser, 2022).
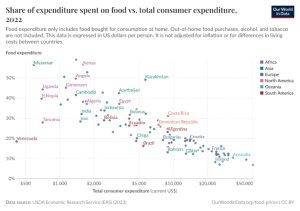
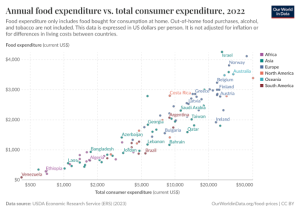
As incomes rise, especially in wealthier nations, spending gradually shifts away from food toward sectors like education, healthcare, housing, and leisure—reflecting broader changes in lifestyle and financial priorities. Meanwhile, diets also tend to diversify, incorporating more luxury items such as meat, dairy, imported goods, and processed foods. This contrasts with lower-income populations, where diets remain heavily reliant on starchy staples due to cost constraints.
Policy Implications
Engel curves provide valuable insights for food security and nutrition policy, particularly when viewed through the lens of national income levels. In low-income countries, where household incomes are limited, a large share of earnings goes toward food, making these populations highly vulnerable to food price volatility. This highlights the importance of price stability and affordable staples in maintaining food security.
As countries move into middle-income status, rising incomes trigger a dietary transition—households begin to consume more processed and convenience foods, which often lack nutritional value. This shift calls for public health policies that promote nutrition education, food labeling, and regulation of unhealthy food marketing to mitigate the rise in diet-related diseases.
Additionally, Engel curves help refine poverty measurement. Instead of relying solely on static income thresholds, they account for actual spending behavior—revealing that even in middle-income countries, households above the poverty line may still experience food deprivation if their consumption falls below expected levels. This makes Engel curves a powerful tool for designing targeted interventions based on both income and consumption patterns.
Conclusion
Engel curves provide valuable insights into economic behavior, from food consumption patterns to poverty measurement. Beyond income elasticity, they reveal how rising incomes shape diet quality and spending priorities. As global incomes grow, Engel curves will continue to guide policies ensuring food security, nutrition, and equitable economic development.
—————
Masters, William A., Amelia B. Finaret, and Steven A. Block. “The Economics of Malnutrition: Dietary Transition and Food System Transformation.” Handbook of Agricultural Economics, edited by Christopher B. Barrett and David R. Just, vol. 6, Elsevier, 2022, pp. 4997-5083. ScienceDirect, https://doi.org/10.1016/bs.hesagr.2022.03.006.
Kumar, T. Krishna, et al. “Engel Curve Method for Measuring Poverty.” Economic and Political Weekly, vol. 43, no. 30, 2008, pp. 115–123. JSTOR, http://www.jstor.org/stable/40277777. Accessed 20 Feb. 2025.
Ritchie, Hannah. “Engel’s Law: Richer People Spend More Money on Food, but It Makes Up a Smaller Share of Their Income.” OurWorldinData.org, 2023, https://ourworldindata.org/engels-law-food-spending.
Clements, K. W., & Si, J. (2018). Engel’s Law, Diet Diversity, and the Quality of Food Consumption. American Journal of Agricultural Economics, 100(1), 1–22. https://doi.org/10.1093/ajae/aax053